Children Served
451
Total children served by the program.

Community Health / Family Support
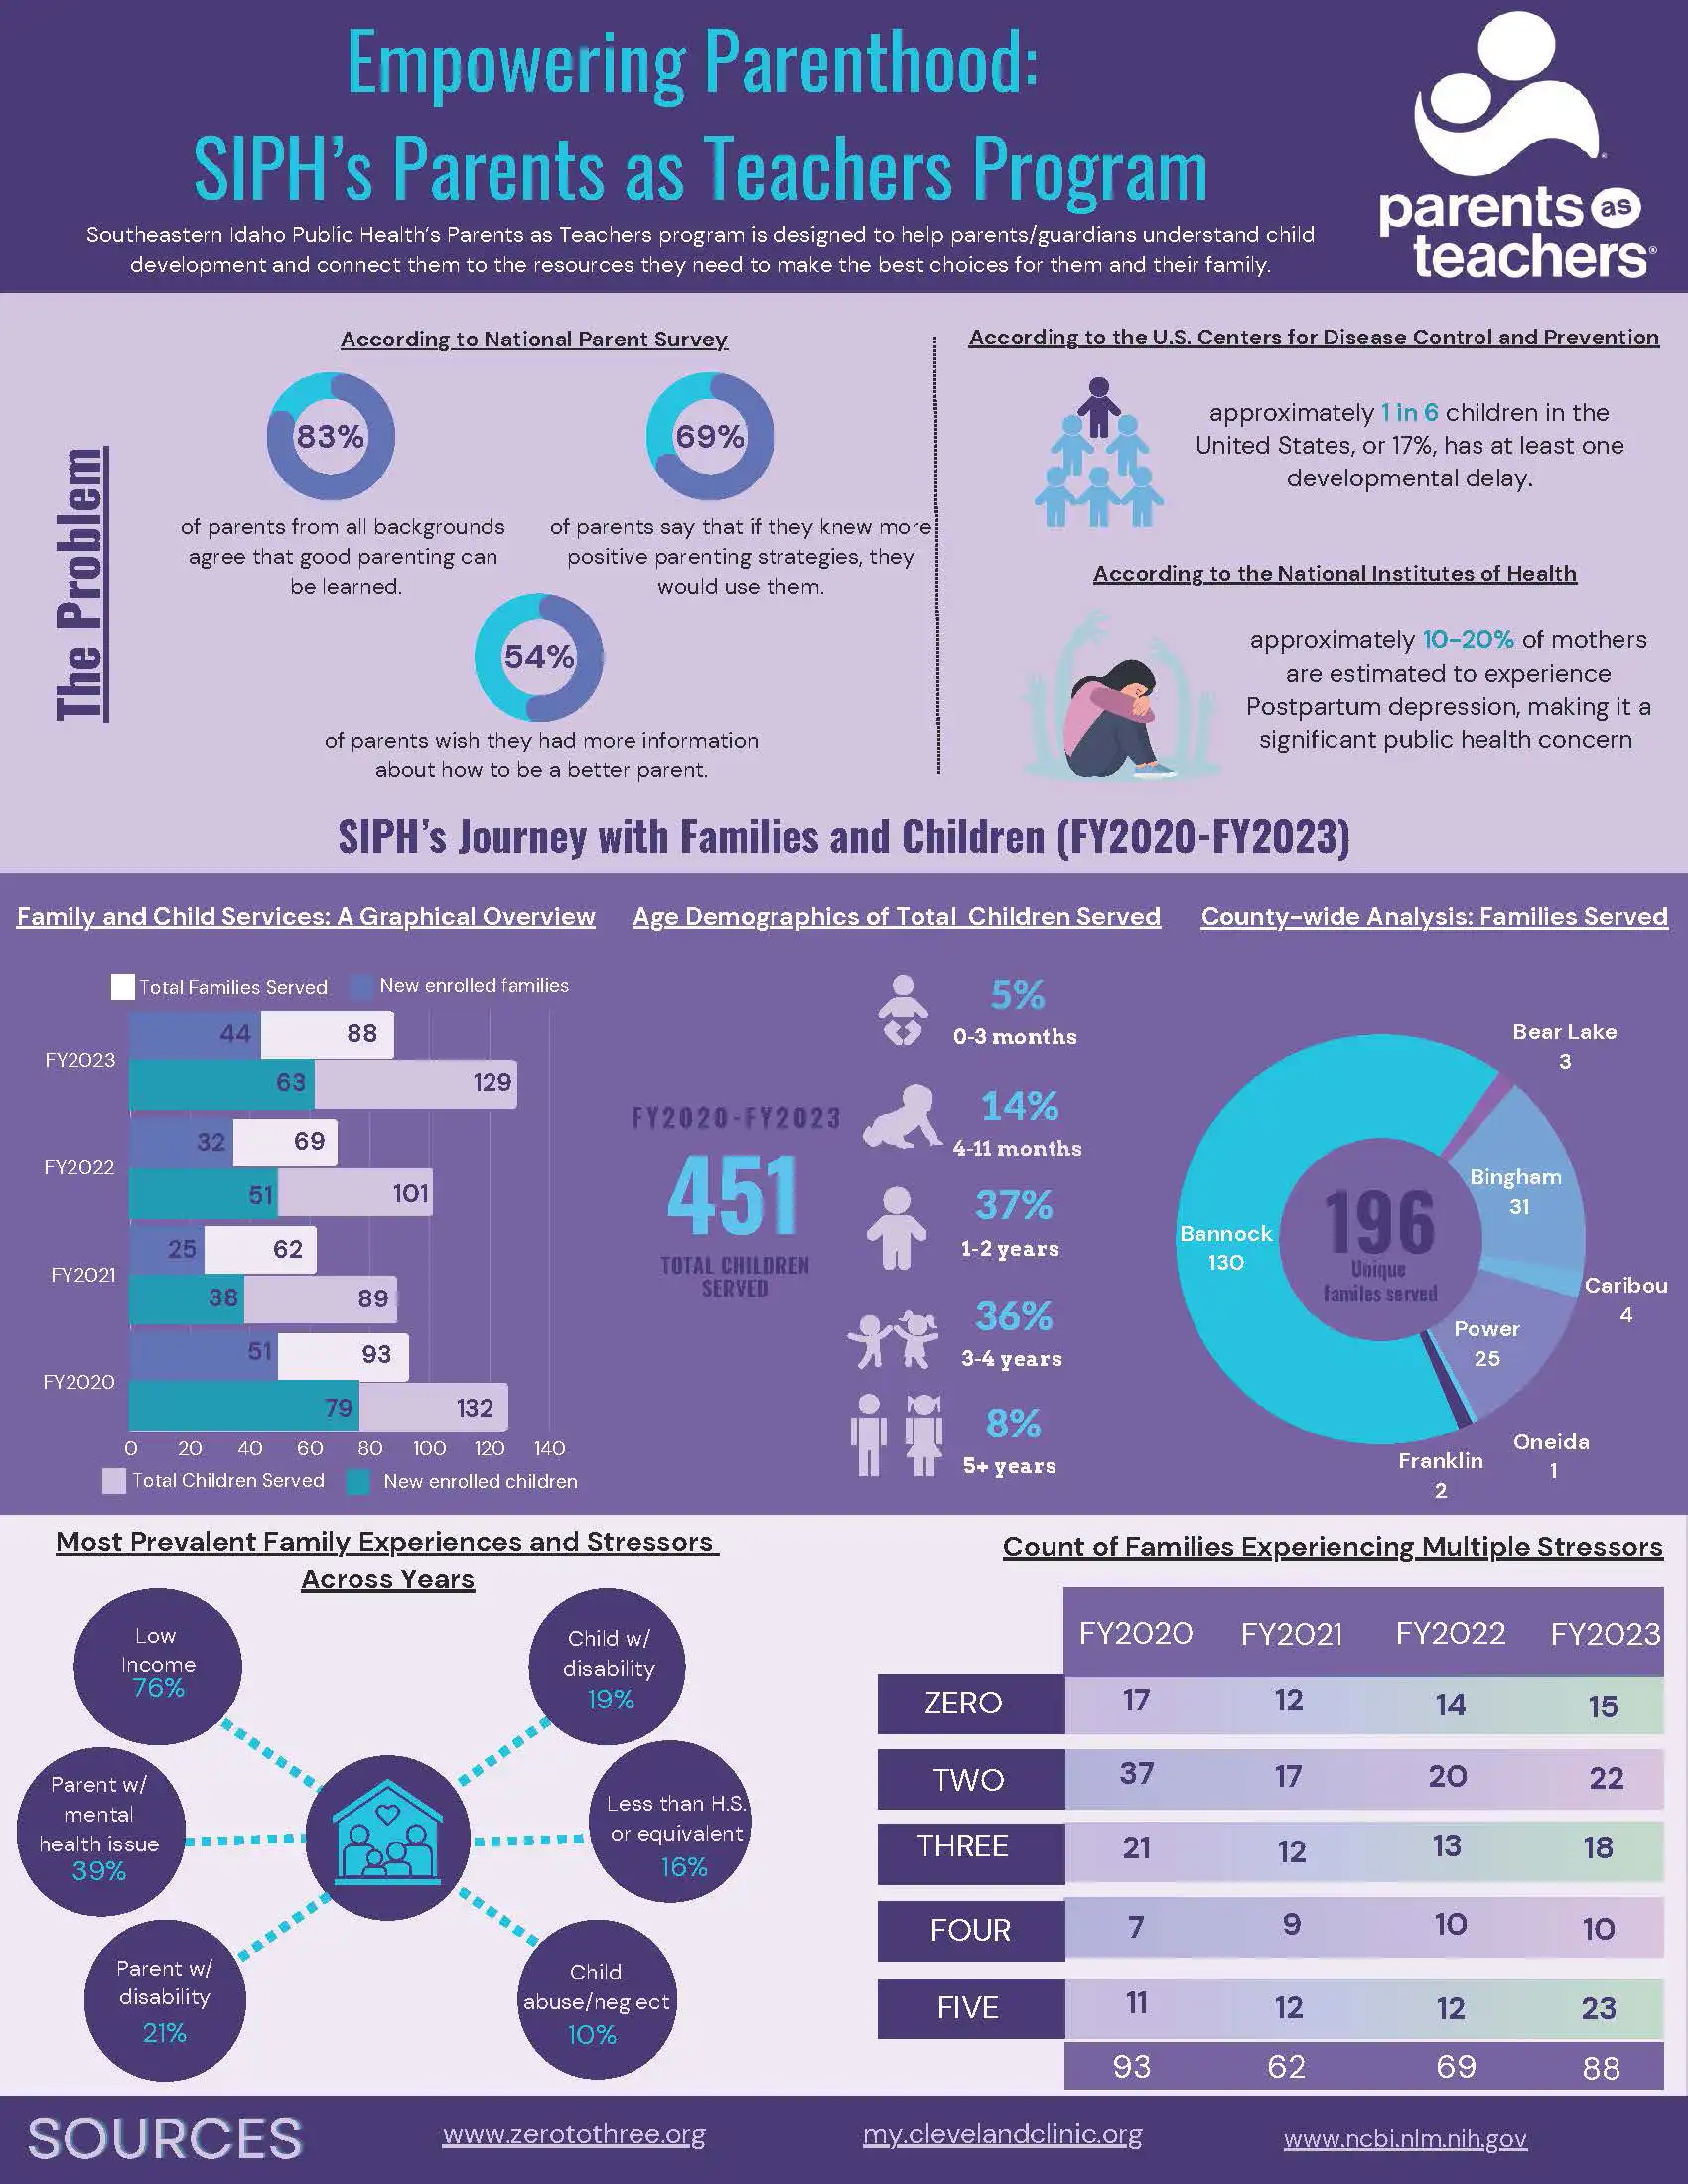
Southeastern Idaho Public Health's Parents as Teachers Program helps parents and guardians understand child development and connect with resources that support healthy children and stronger families.
Selected results from FY2020 through FY2023.
Children Served
Total children served by the program.
Unique Families
Unique families served across six counties.
In-Person Visits
Personal visits delivered in person.
Families Connected
Annual family-resource connections reported across FY2020-FY2023.
Open each section for accessible tables and supporting details.
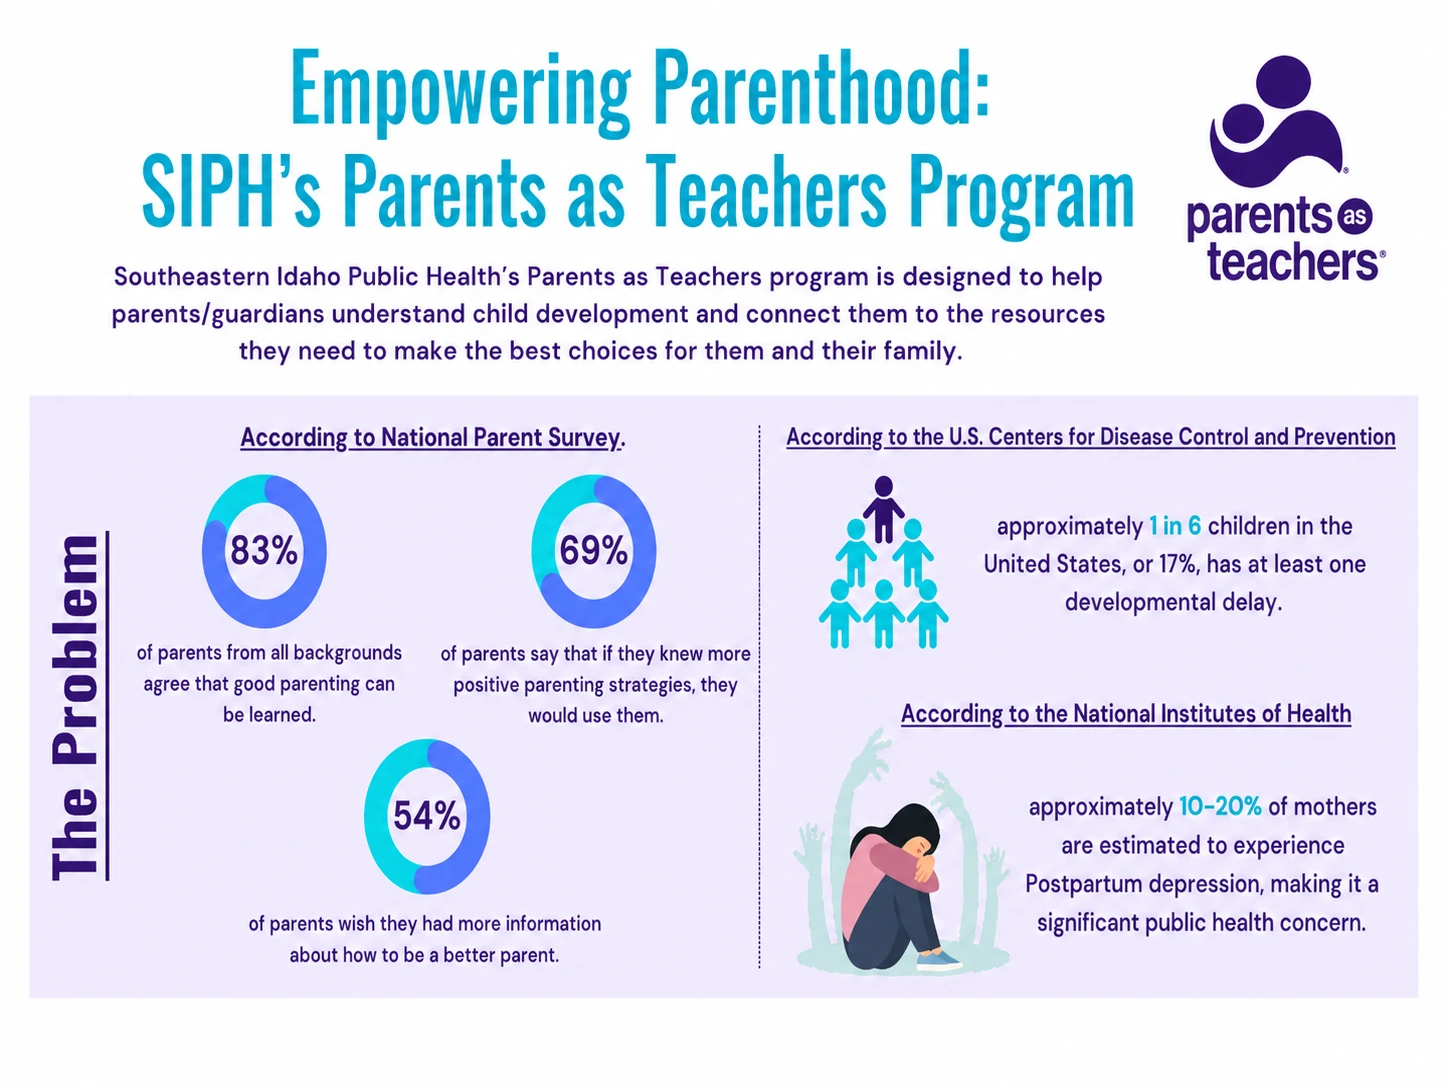
The report highlights strong interest in parenting education, along with the prevalence of developmental delays and postpartum depression.
| Measure | Reported Value |
|---|---|
| Parents who agree good parenting can be learned | 83% |
| Parents who would use more positive parenting strategies if they knew them | 69% |
| Parents who want more information about being a better parent | 54% |
| U.S. children with at least one developmental delay | About 1 in 6 |
| Mothers estimated to experience postpartum depression | 10%-20% |
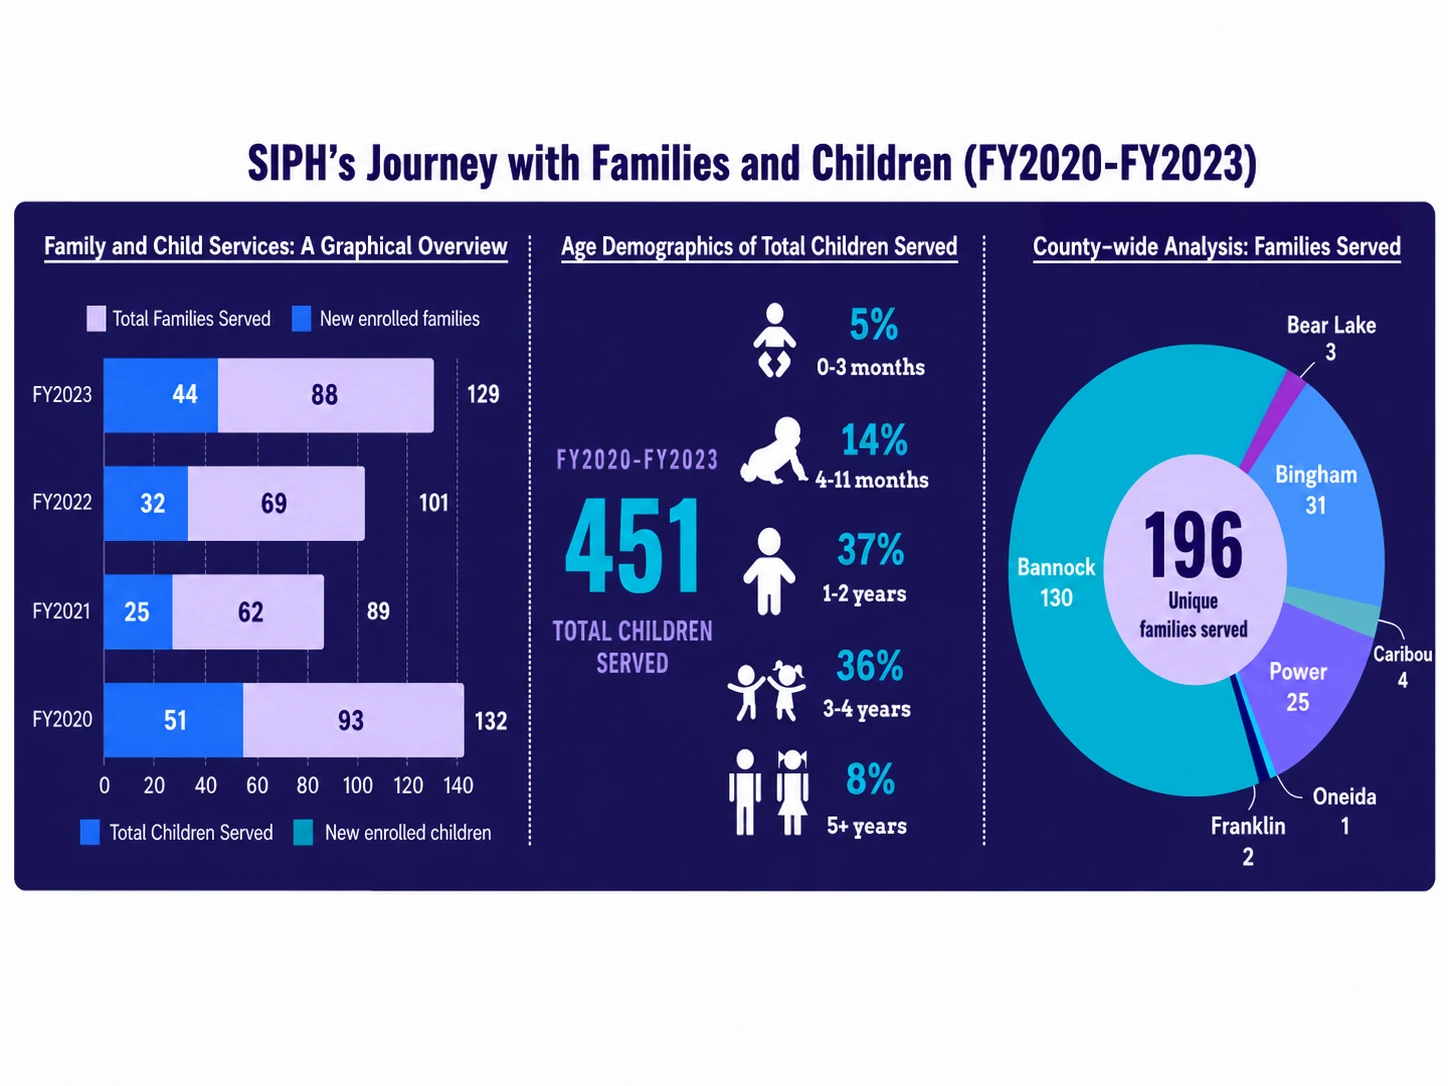
From FY2020 through FY2023, the program served 451 children and 196 unique families. Most families were located in Bannock County.
| Fiscal Year | Families Served | New Families | Children Served | New Children |
|---|---|---|---|---|
| FY2020 | 93 | 51 | 132 | 79 |
| FY2021 | 62 | 25 | 89 | 38 |
| FY2022 | 69 | 32 | 101 | 51 |
| FY2023 | 88 | 44 | 129 | 63 |
| County | Families |
|---|---|
| Bannock | 130 |
| Bingham | 31 |
| Power | 25 |
| Caribou | 4 |
| Bear Lake | 3 |
| Franklin | 2 |
| Oneida | 1 |
| Total | 196 |
| Age Group | Share |
|---|---|
| 0-3 months | 5% |
| 4-11 months | 14% |
| 1-2 years | 37% |
| 3-4 years | 36% |
| 5 years and older | 8% |
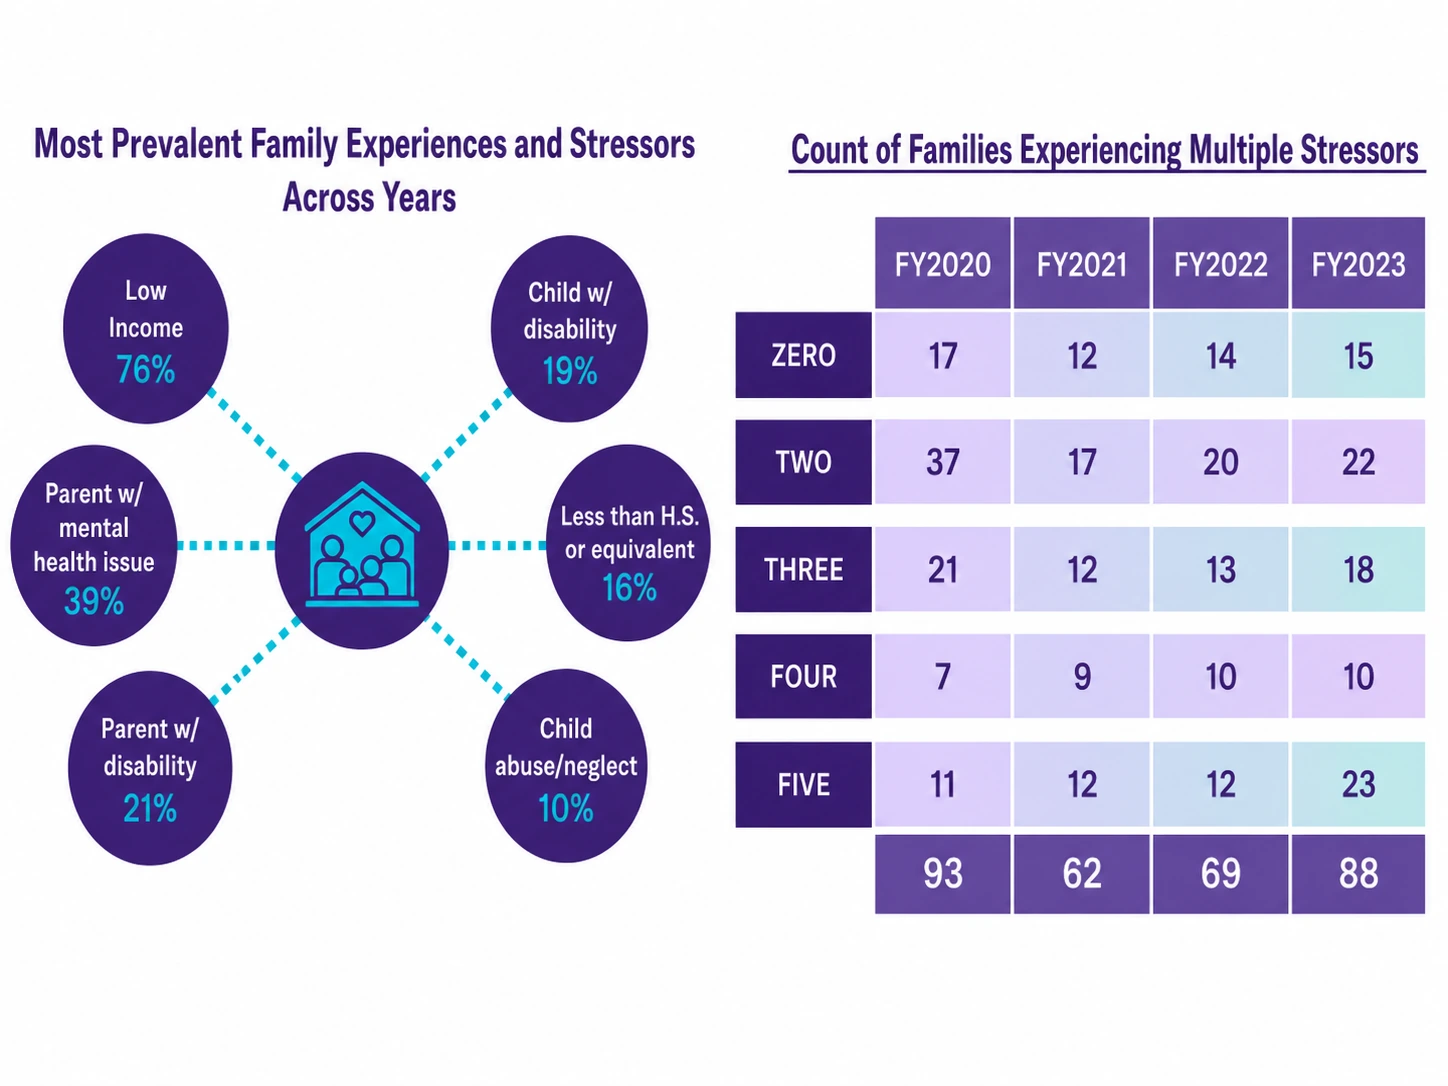
Low income was the most common family stressor, followed by parental mental health concerns and disability-related needs.
| Stressor | Share |
|---|---|
| Low income | 76% |
| Parent with a mental health issue | 39% |
| Parent with a disability | 21% |
| Child with a disability | 19% |
| Less than high school education or equivalent | 16% |
| Child abuse or neglect | 10% |
The report also tracks families experiencing zero, two, three, four, or five simultaneous stressors across FY2020-FY2023.
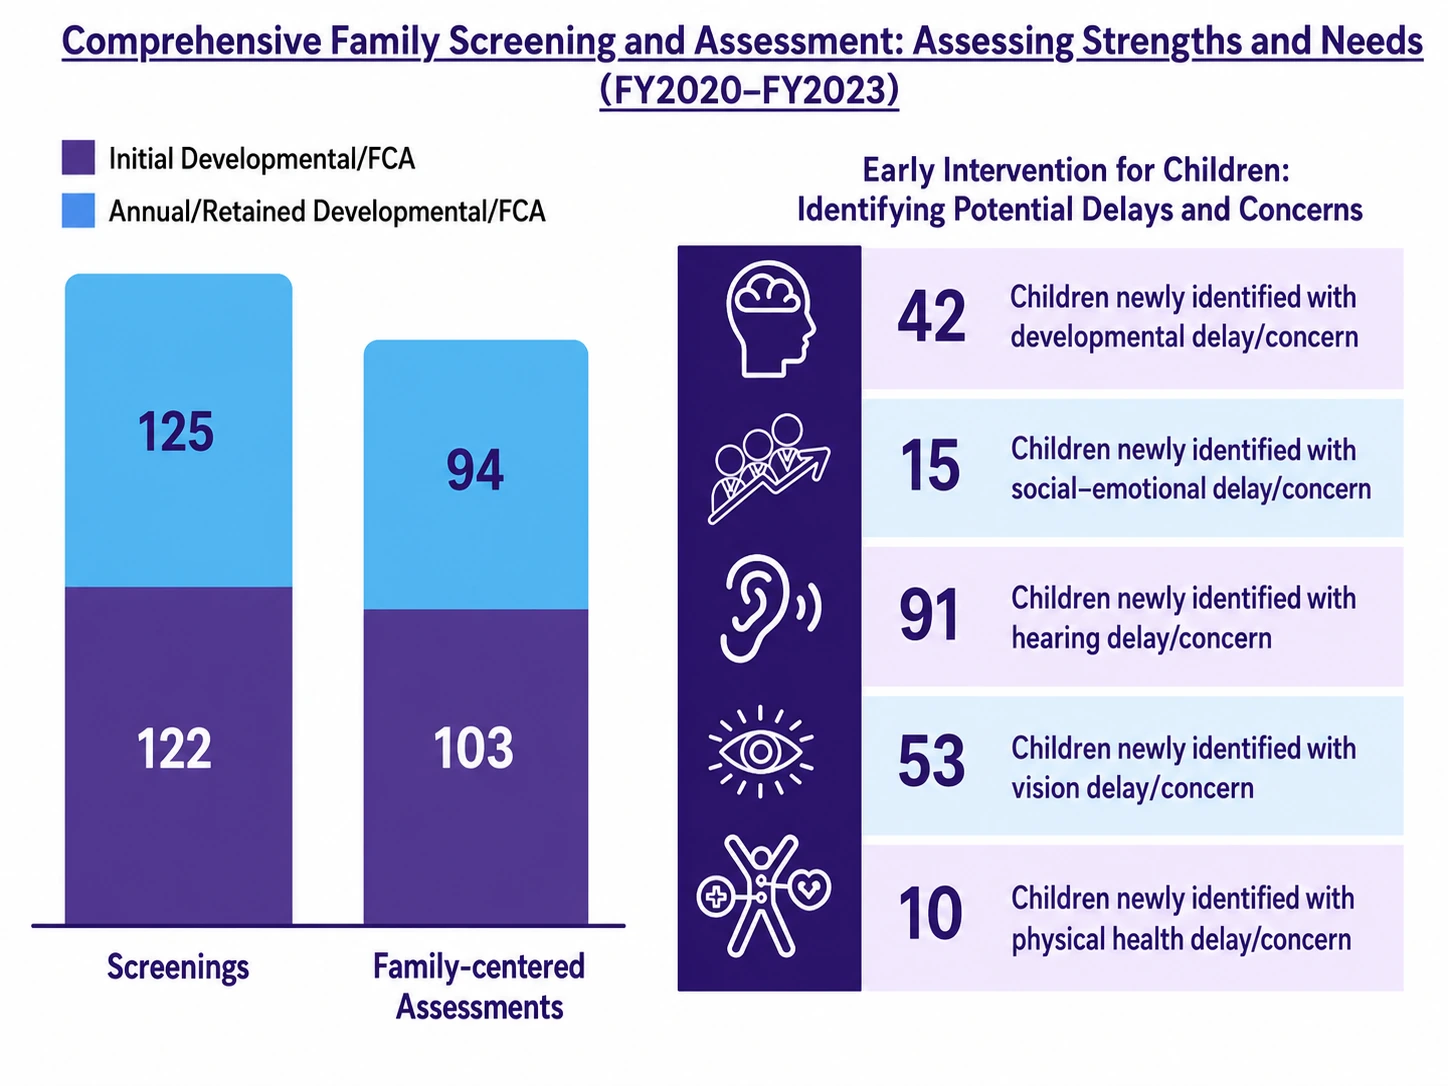
The program completed developmental screenings and family-centered assessments and identified children who needed additional follow-up for developmental, social-emotional, hearing, vision, or physical health concerns.
| Assessment Type | Initial | Annual or Retained |
|---|---|---|
| Developmental screenings | 122 | 125 |
| Family-centered assessments | 103 | 94 |
| Concern | Children |
|---|---|
| Developmental delay or concern | 42 |
| Social-emotional delay or concern | 15 |
| Hearing delay or concern | 91 |
| Vision delay or concern | 53 |
| Physical health delay or concern | 10 |
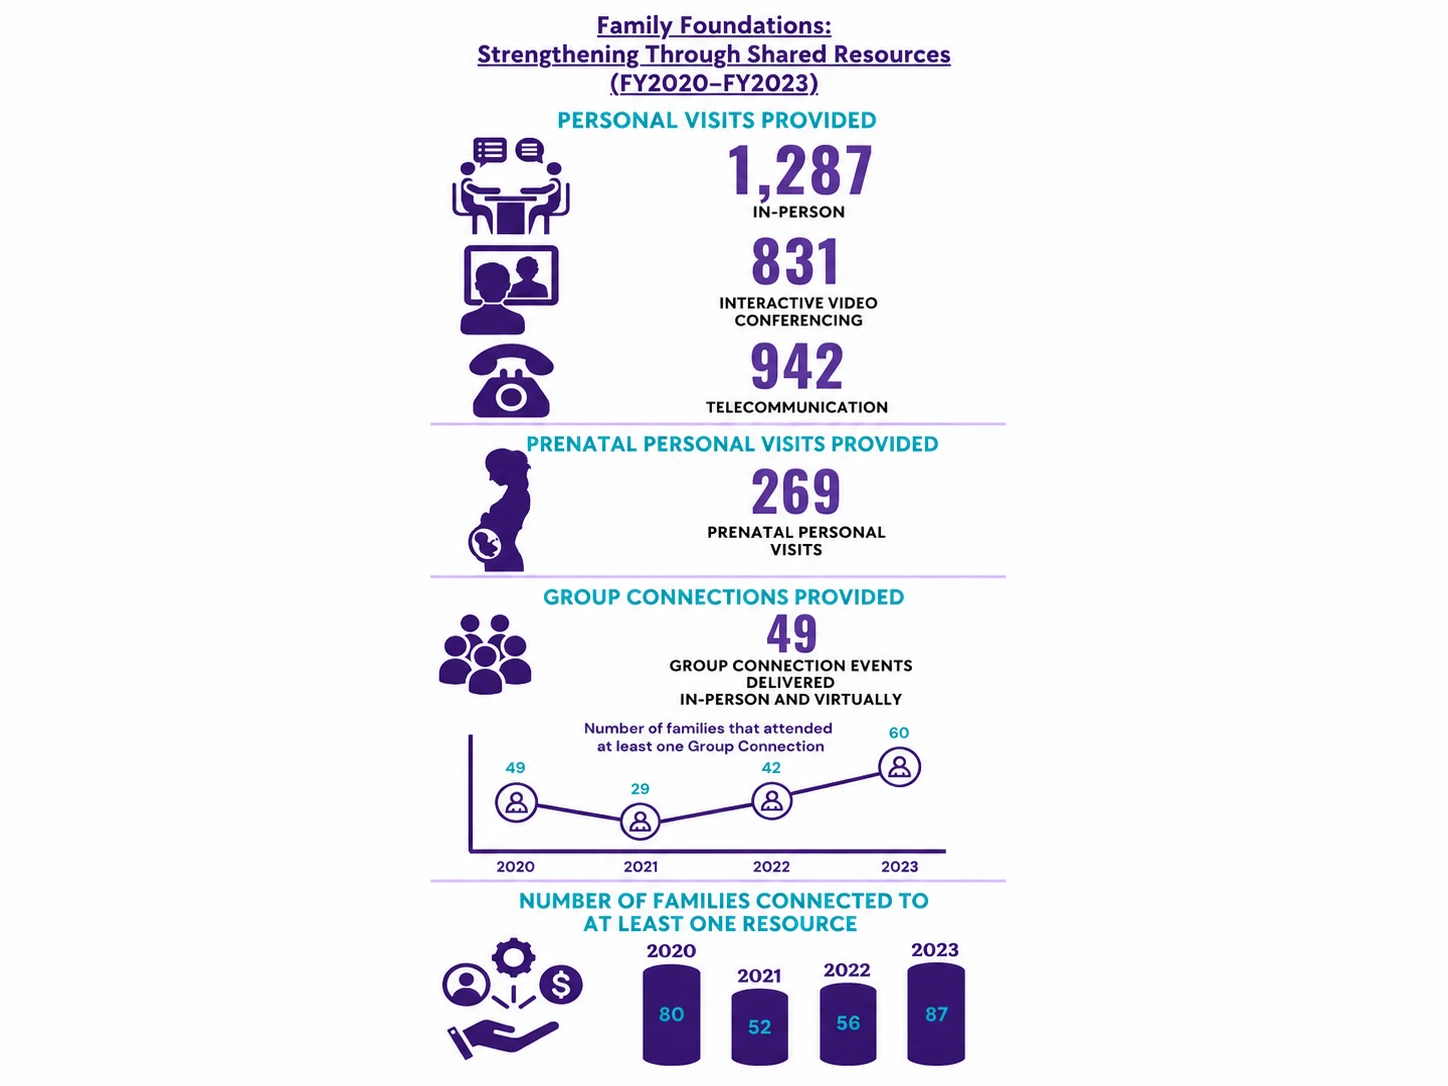
Families received support through in-person visits, video conferencing, telecommunications, prenatal visits, group connections, and resource referrals.
| Service | Count |
|---|---|
| In-person personal visits | 1,287 |
| Interactive video-conference visits | 831 |
| Telecommunication visits | 942 |
| Prenatal personal visits | 269 |
| Group connection events | 49 |
| Year | Families |
|---|---|
| 2020 | 80 |
| 2021 | 52 |
| 2022 | 56 |
| 2023 | 87 |
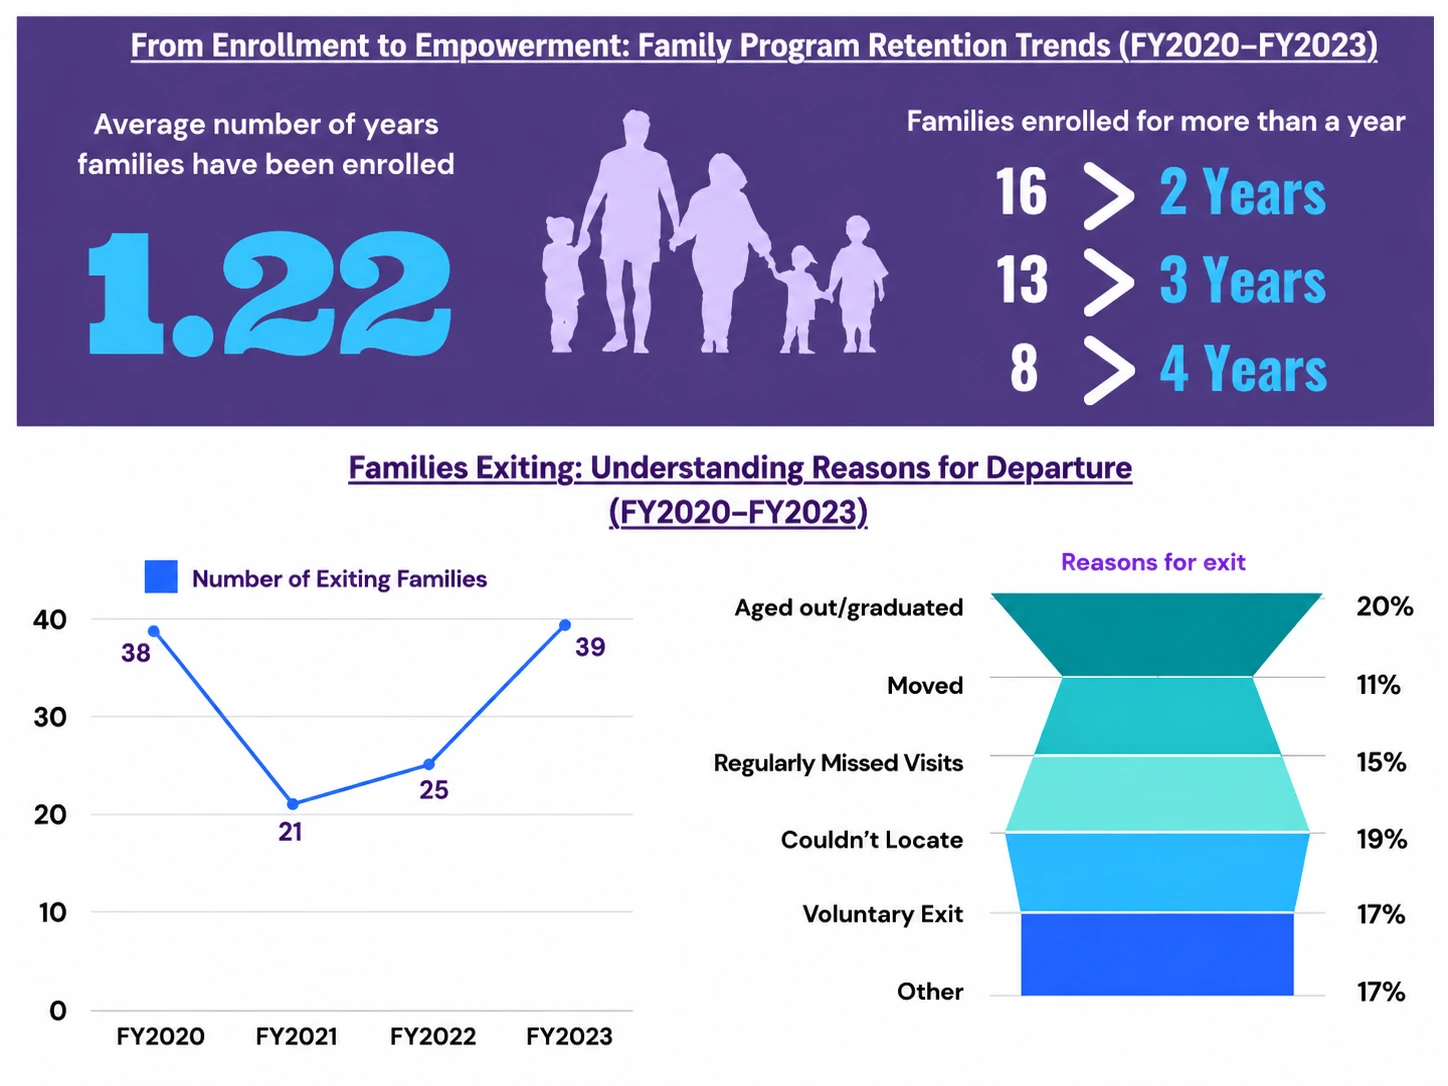
Families remained enrolled for an average of 1.22 years. The report also tracks long-term enrollment and reasons families left the program.
| Measure | Value |
|---|---|
| Average years enrolled | 1.22 |
| Families enrolled more than 2 years | 16 |
| Families enrolled more than 3 years | 13 |
| Families enrolled more than 4 years | 8 |
| Reason | Share |
|---|---|
| Aged out or graduated | 20% |
| Moved | 11% |
| Regularly missed visits | 15% |
| Could not locate | 19% |
| Voluntary exit | 17% |
| Other | 17% |
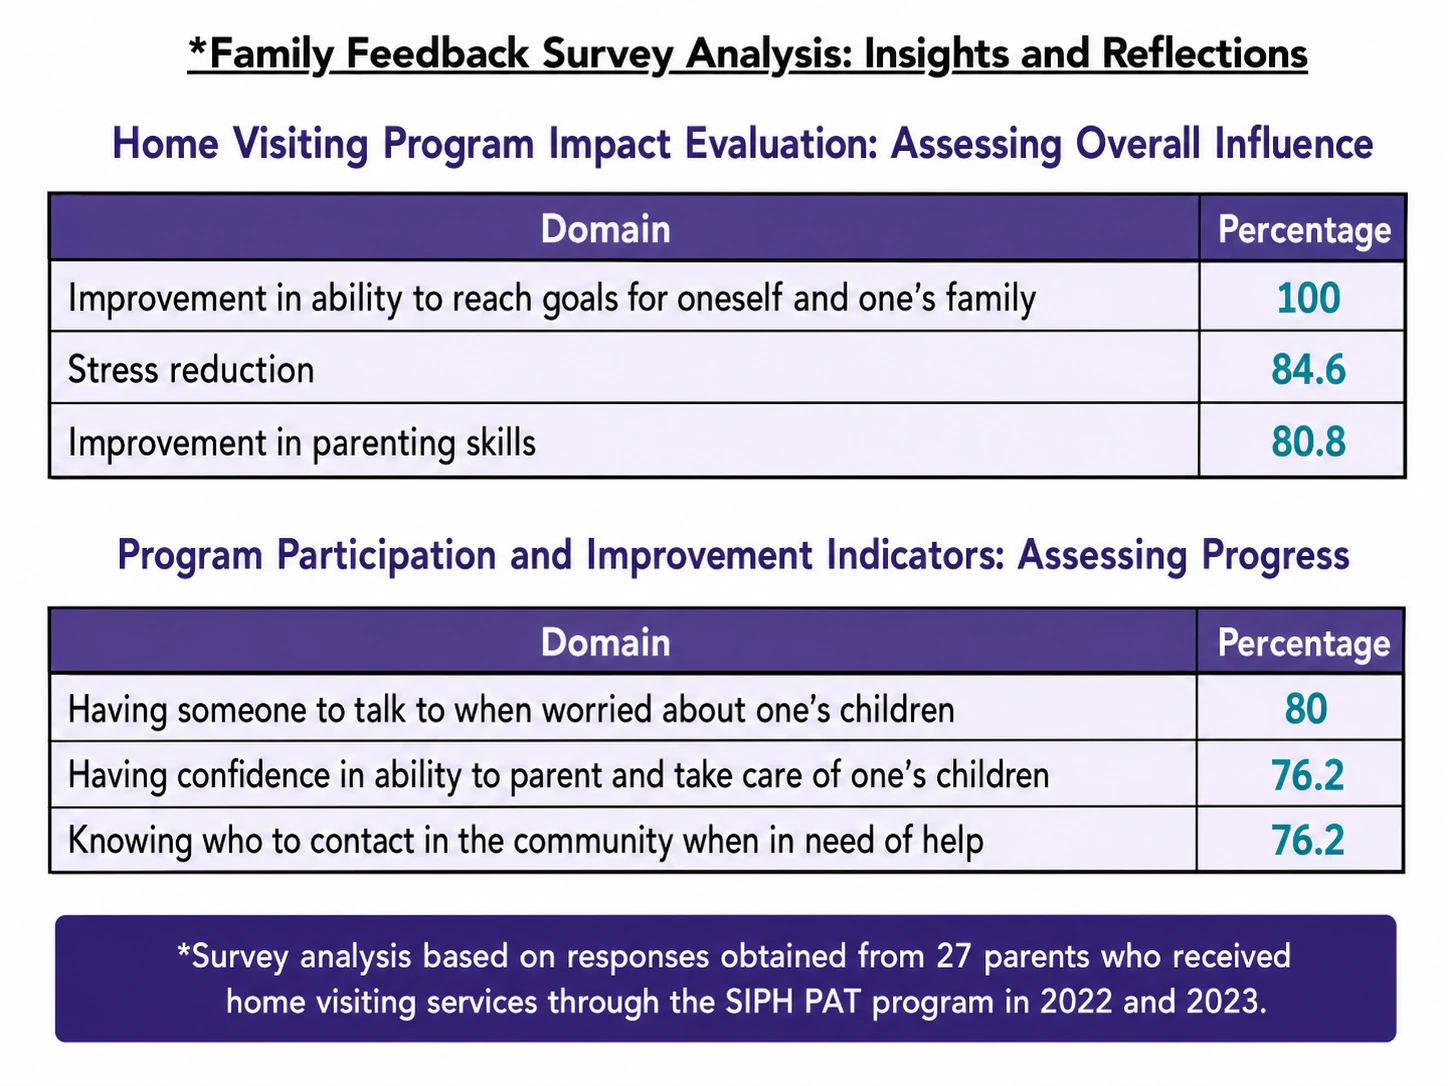
Survey responses from 27 parents indicate strong improvement in goal-setting, stress reduction, parenting skills, confidence, and access to community support.
| Survey Domain | Positive Response |
|---|---|
| Improved ability to reach goals for self and family | 100% |
| Stress reduction | 84.6% |
| Improvement in parenting skills | 80.8% |
| Having someone to talk to when worried about children | 80% |
| Confidence in ability to parent and care for children | 76.2% |
| Knowing who to contact in the community for help | 76.2% |
Survey analysis was based on 27 parents who received home-visiting services in 2022 and 2023.
Select an image to open a larger version, or view the original PDF.
Parenting needs, families and children served, demographics, counties, and family stressors.
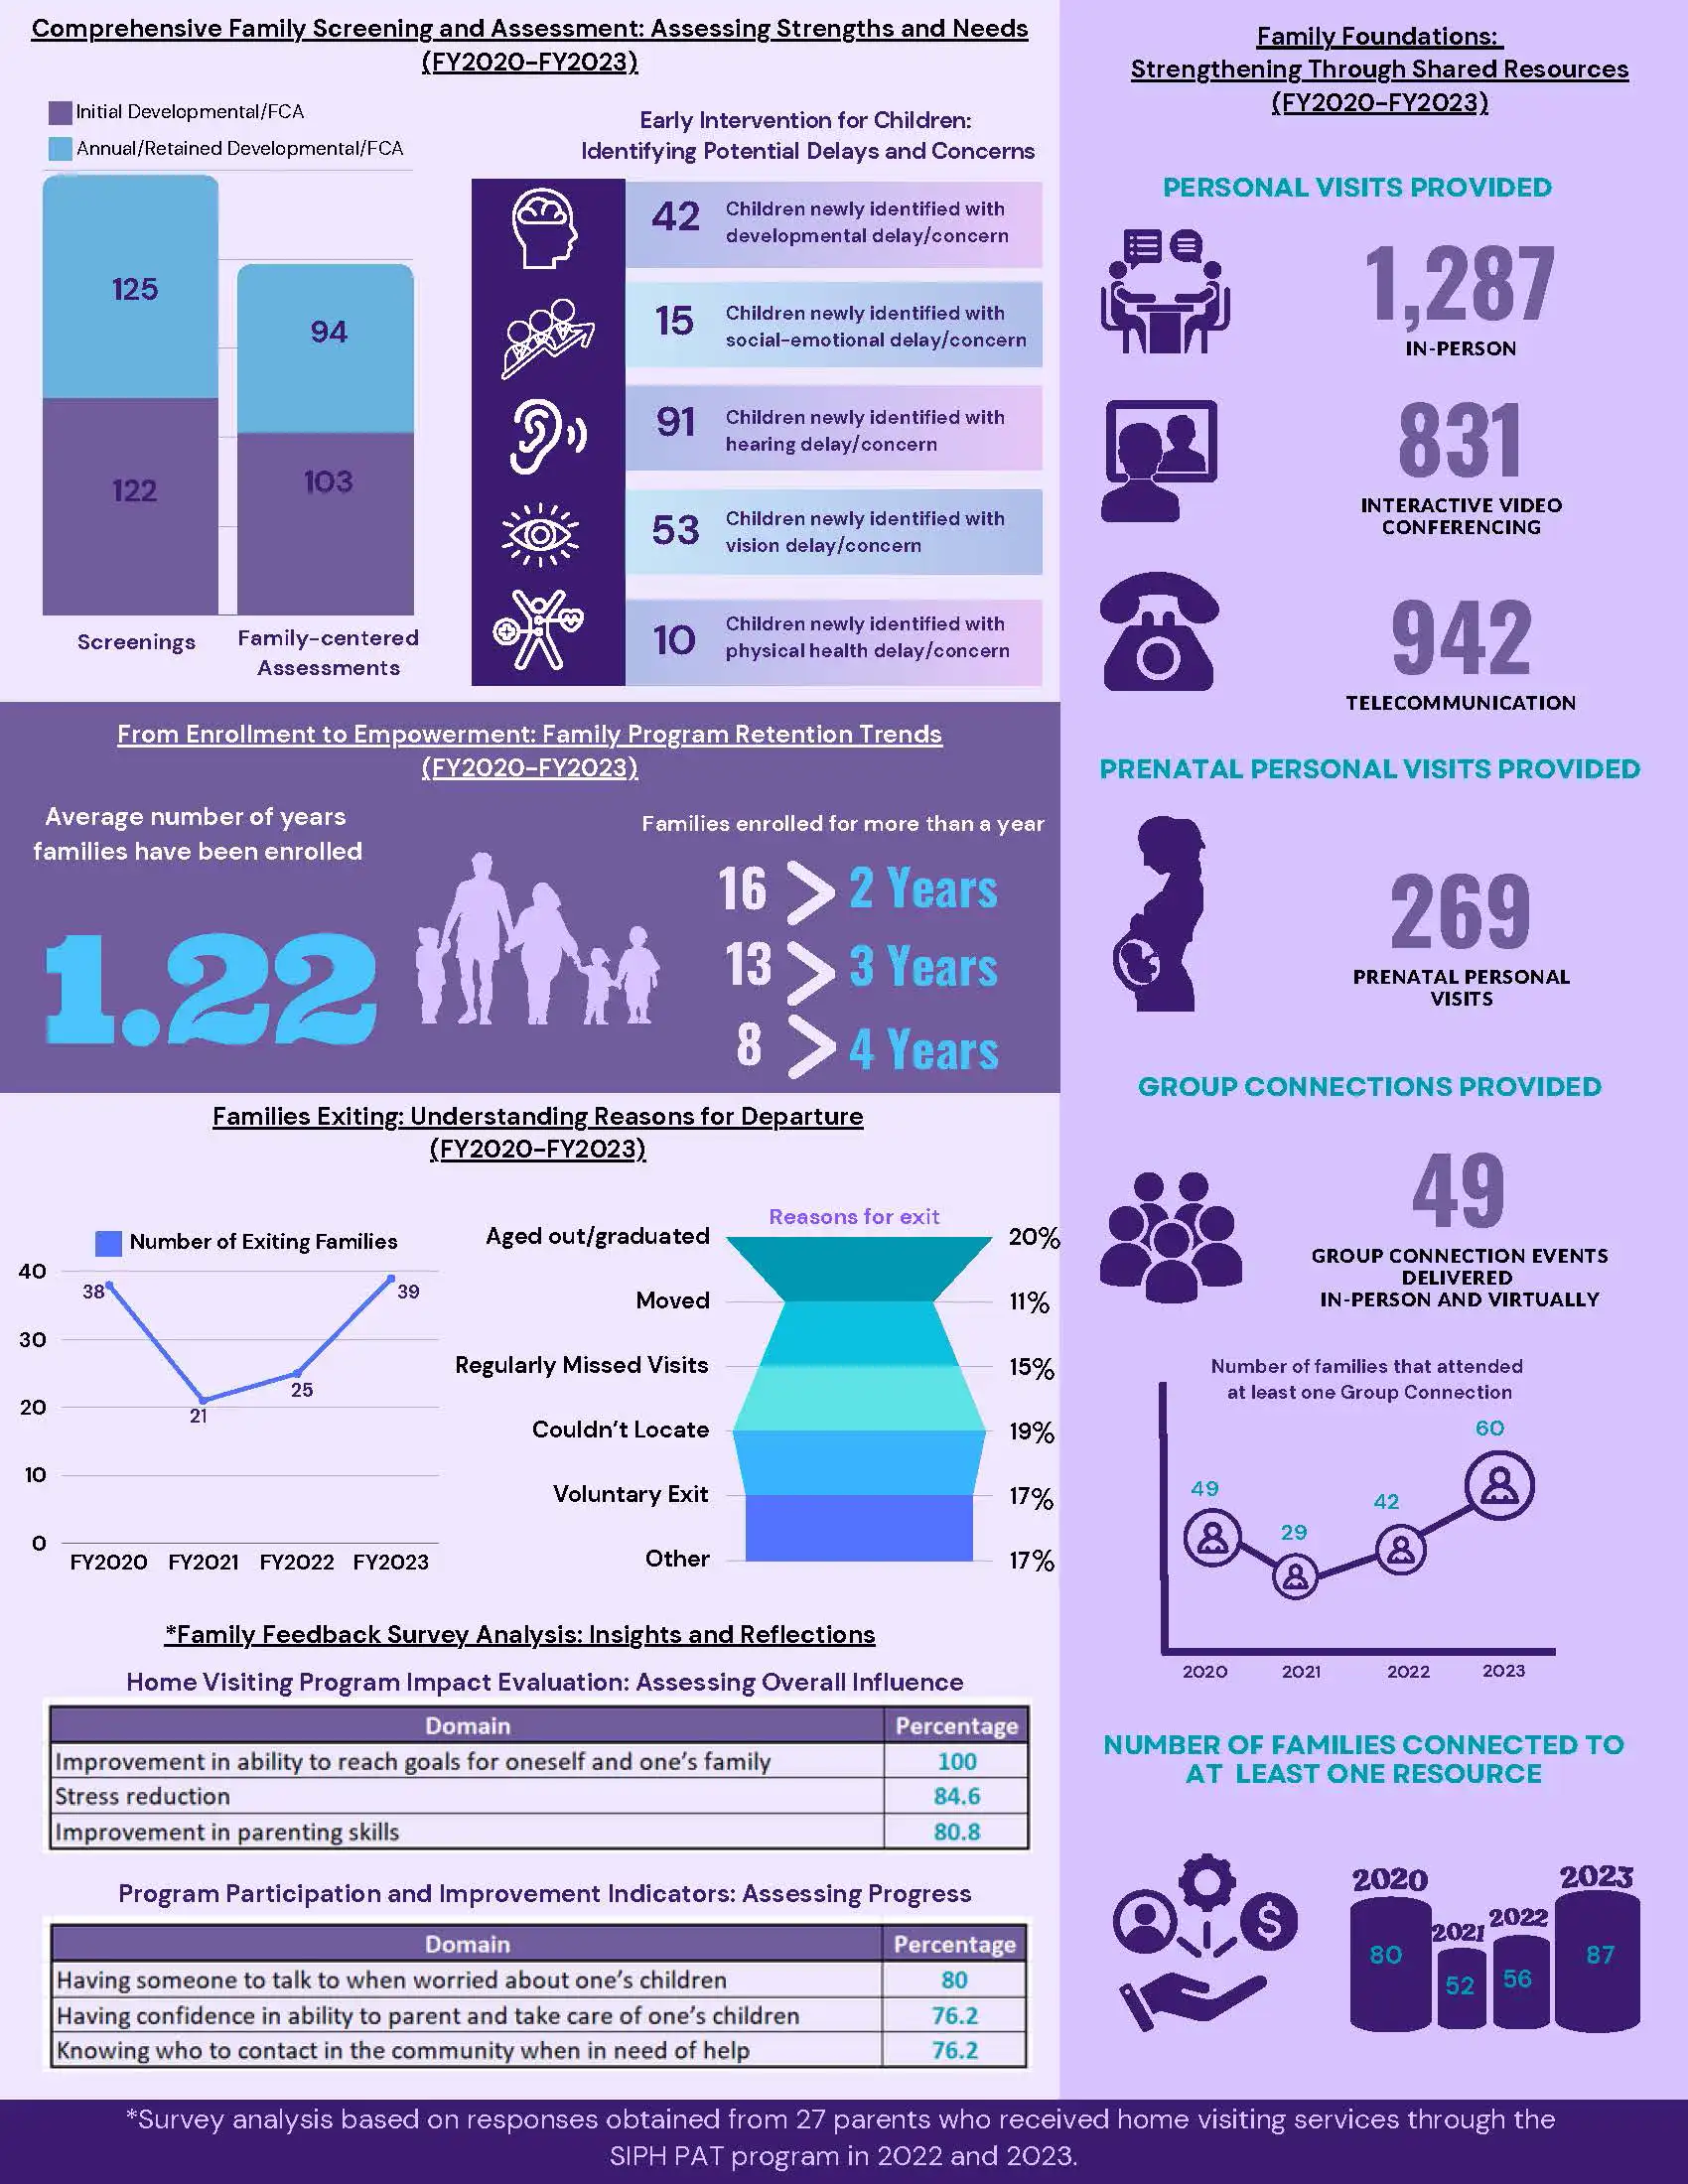
Developmental screening, home visits, referrals, retention, family exit, and parent feedback.