Average Annual Licenses
16
Average number of pool licenses issued annually.

Environmental Health / Public Pools
Southeastern Idaho Public Health's Public Pool Safety Program protects community health by helping ensure public swimming facilities meet safety and sanitation standards. Through inspections, education, and compliance support, SIPH helps prevent waterborne illness and promotes safe recreational environments.
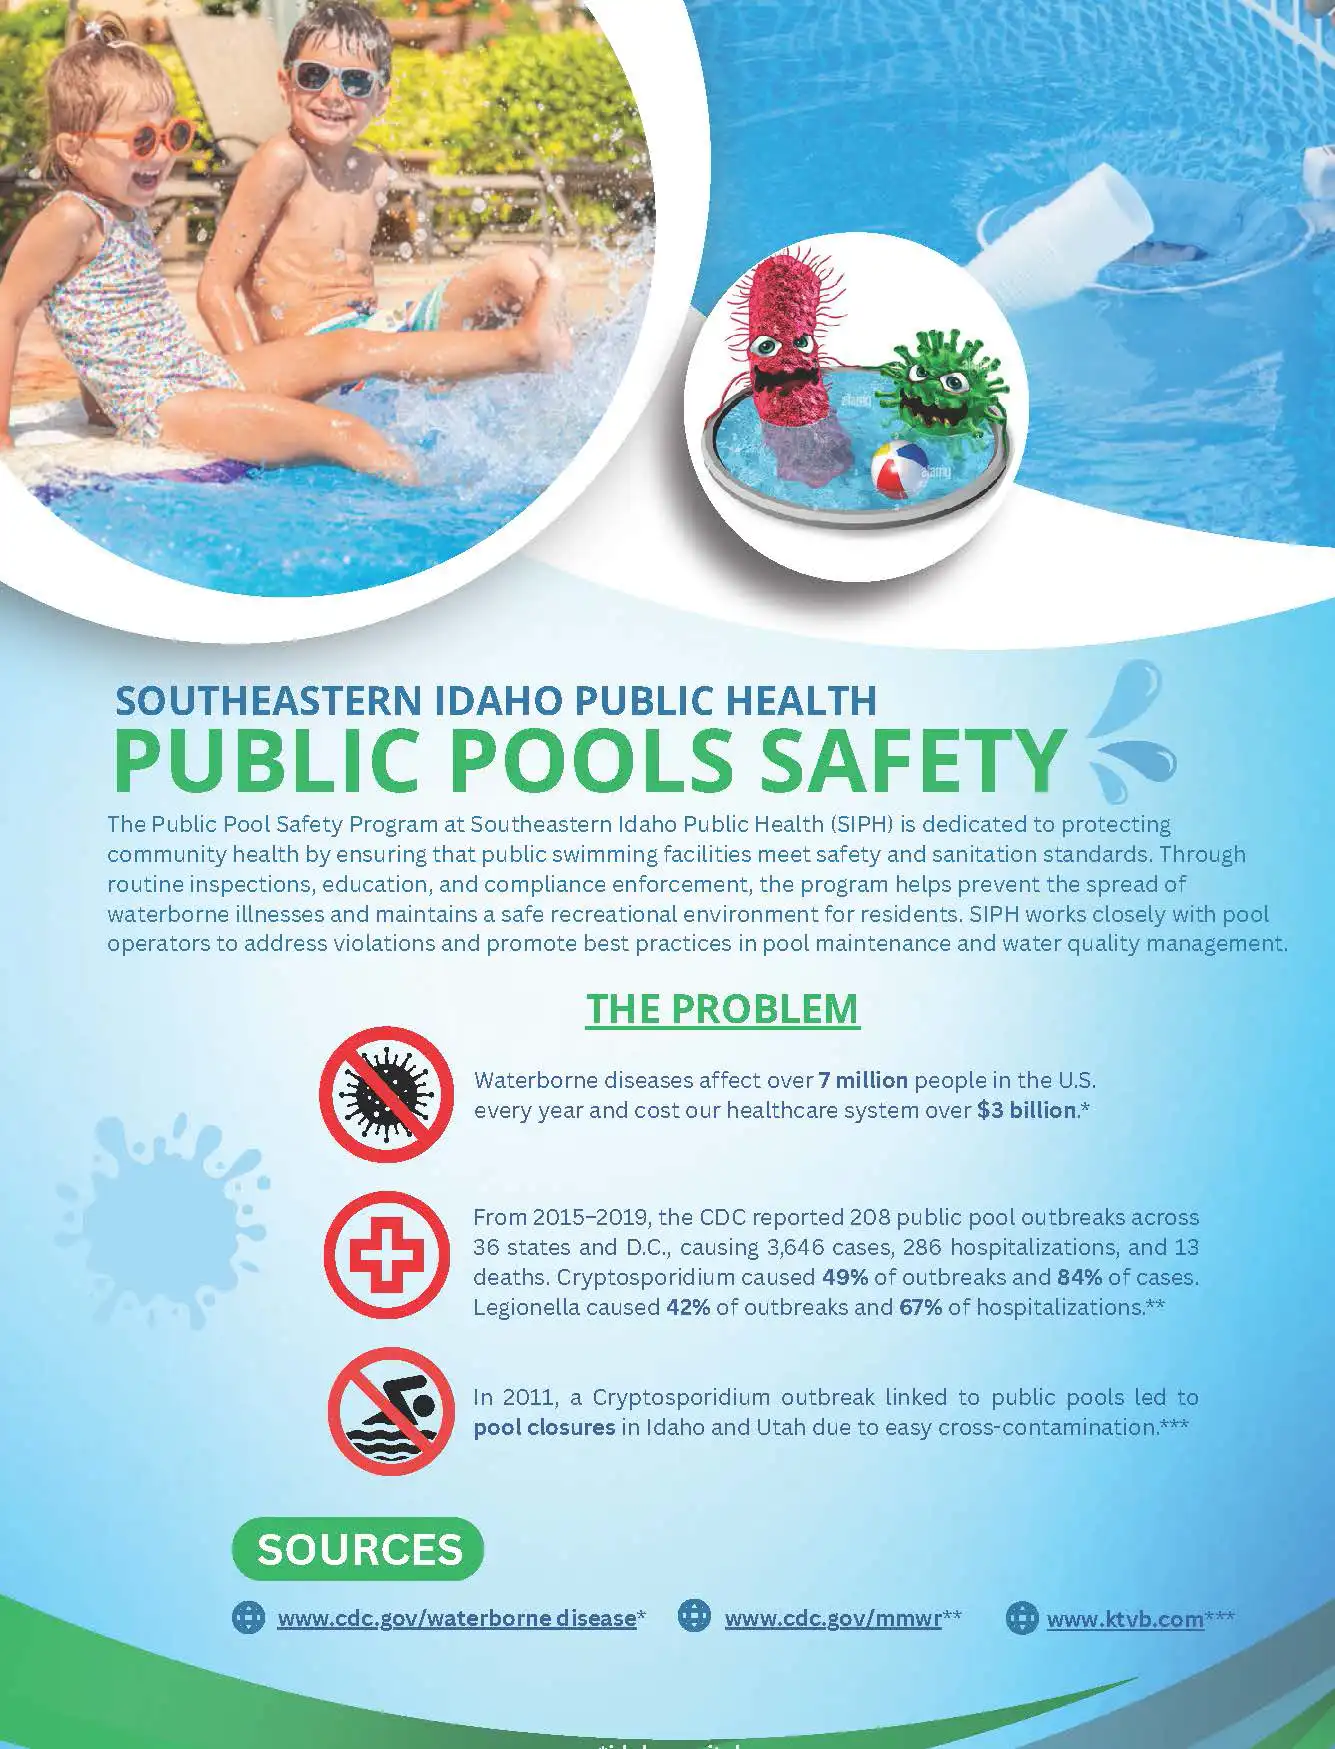
Selected public pool safety and inspection measures from 2020 through 2024.
Average Annual Licenses
Average number of pool licenses issued annually.
Routine Inspections
Routine inspections recorded from 2020 through 2024.
Follow-Up Inspections
Follow-up inspections recorded during the review period.
Most Common Violation
Chlorine level violations, the most common violation category shown.
Open each section for accessible tables and supporting details.
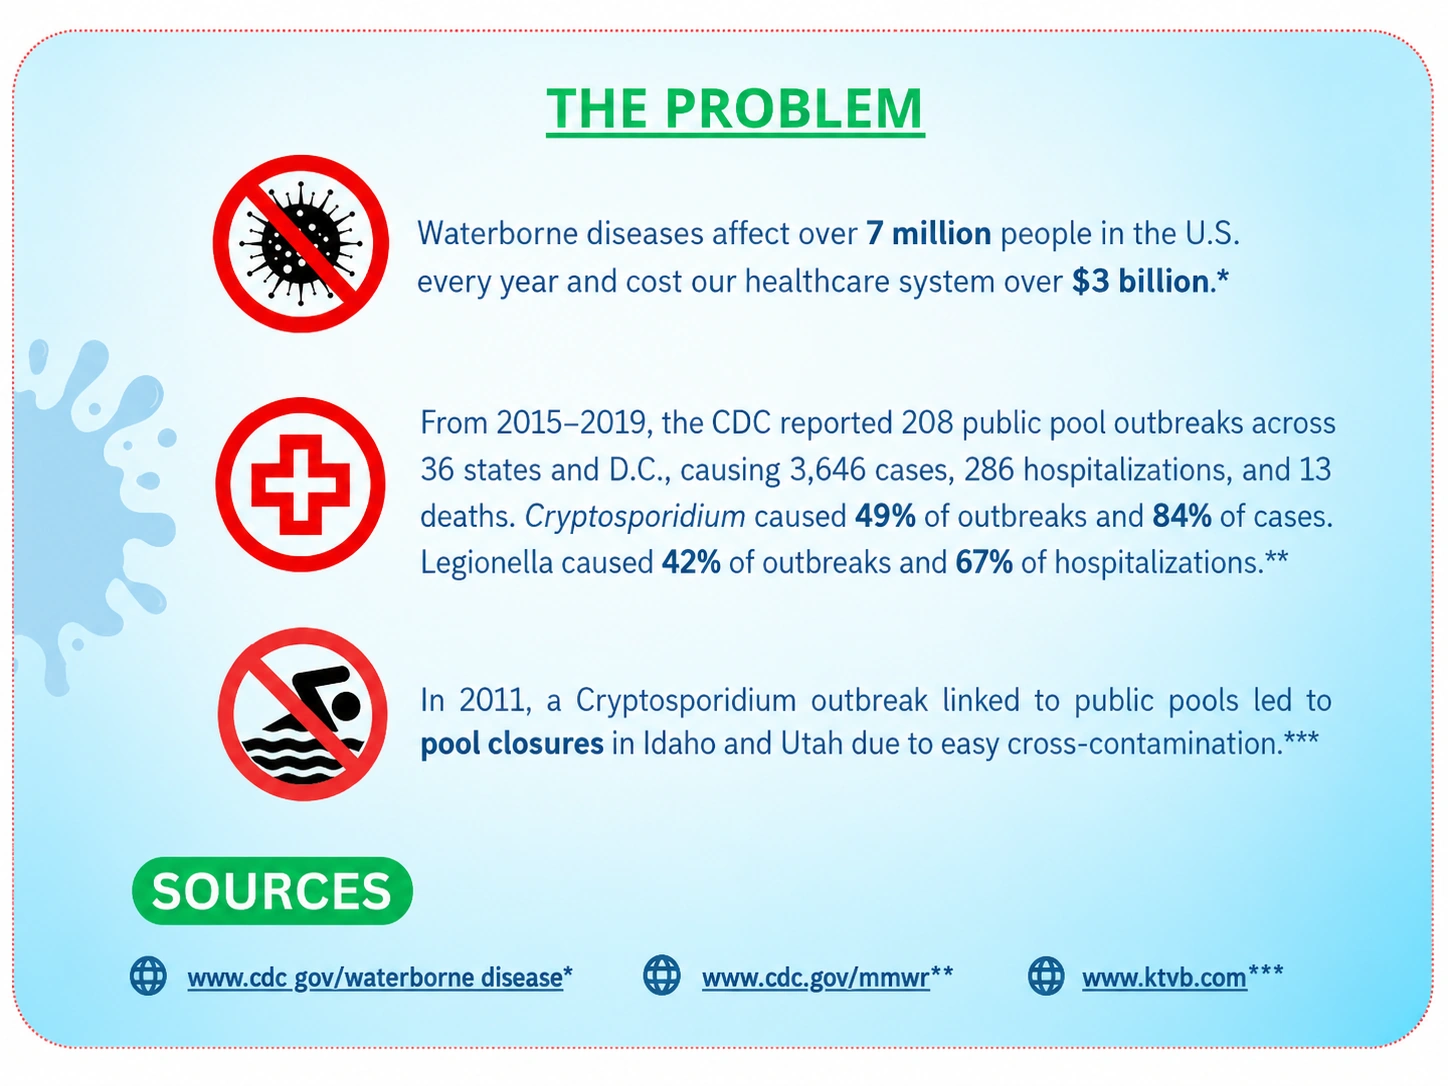
Waterborne disease can spread through recreational water settings. The report highlights national public pool outbreak data and a 2011 Cryptosporidium outbreak linked to public pools in Idaho and Utah.
| Measure | Reported Value |
|---|---|
| People affected by waterborne diseases in the U.S. each year | More than 7 million |
| Annual healthcare cost from waterborne diseases | More than $3 billion |
| CDC-reported public pool outbreaks, 2015-2019 | 208 outbreaks across 36 states and D.C. |
| Cases from public pool outbreaks, 2015-2019 | 3,646 |
| Hospitalizations from public pool outbreaks, 2015-2019 | 286 |
| Deaths from public pool outbreaks, 2015-2019 | 13 |
| Outbreaks caused by Cryptosporidium | 49% |
| Cases caused by Cryptosporidium | 84% |
| Outbreaks caused by Legionella | 42% |
| Hospitalizations caused by Legionella | 67% |
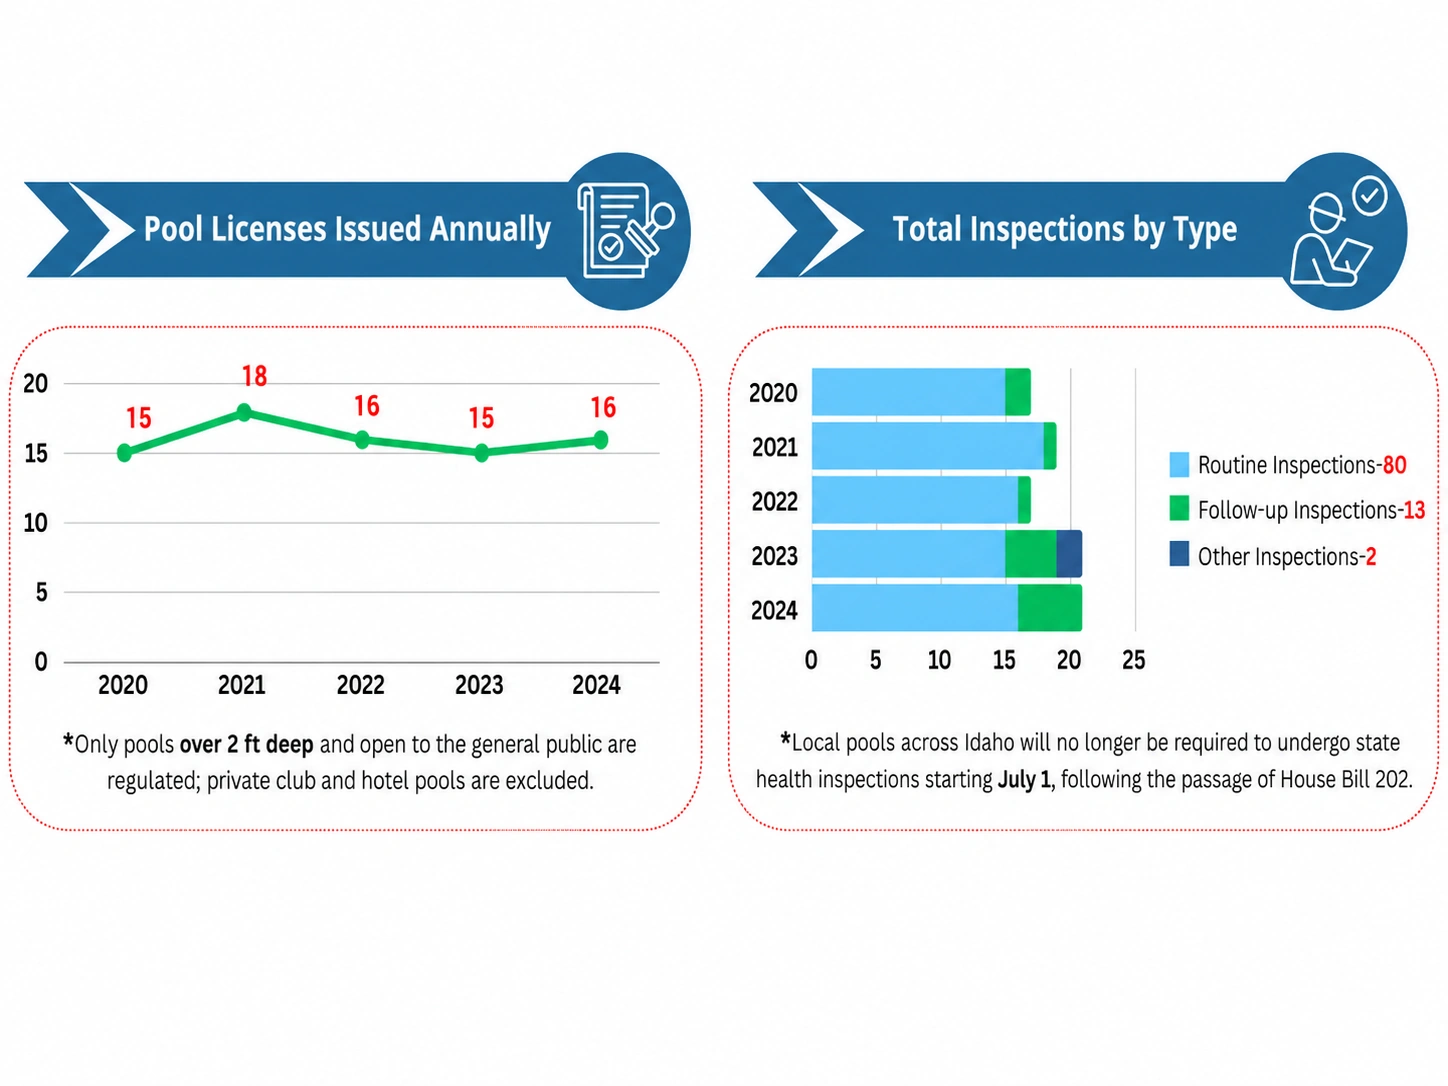
SIPH issued between 15 and 18 pool licenses annually from 2020 through 2024. Routine inspections made up the majority of inspection activity.
| Year | Licenses Issued |
|---|---|
| 2020 | 15 |
| 2021 | 18 |
| 2022 | 16 |
| 2023 | 15 |
| 2024 | 16 |
| Inspection Type | Count |
|---|---|
| Routine inspections | 80 |
| Follow-up inspections | 13 |
| Other inspections | 2 |
The source notes that only pools over 2 feet deep and open to the general public are regulated; private club and hotel pools are excluded.
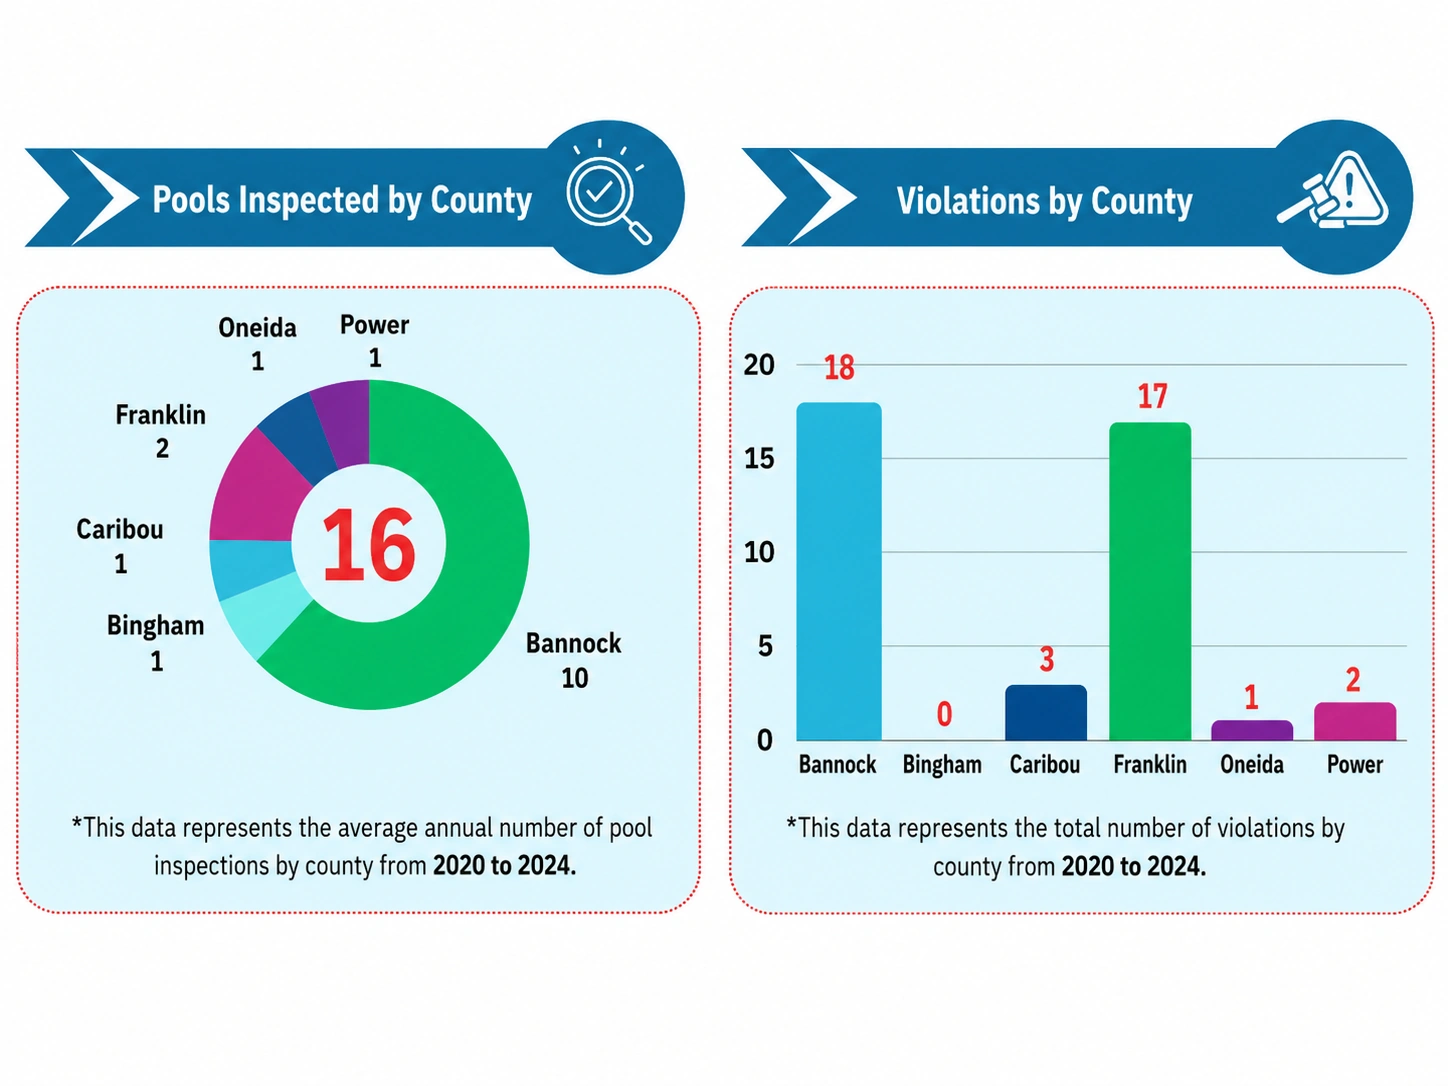
Bannock County had the highest average annual number of inspected pools, while Bannock and Franklin counties had the most violations recorded from 2020 through 2024.
| County | Pools Inspected |
|---|---|
| Bannock | 10 |
| Franklin | 2 |
| Bingham | 1 |
| Caribou | 1 |
| Oneida | 1 |
| Power | 1 |
| Total shown | 16 |
| County | Violations |
|---|---|
| Bannock | 18 |
| Bingham | 0 |
| Caribou | 3 |
| Franklin | 17 |
| Oneida | 1 |
| Power | 2 |
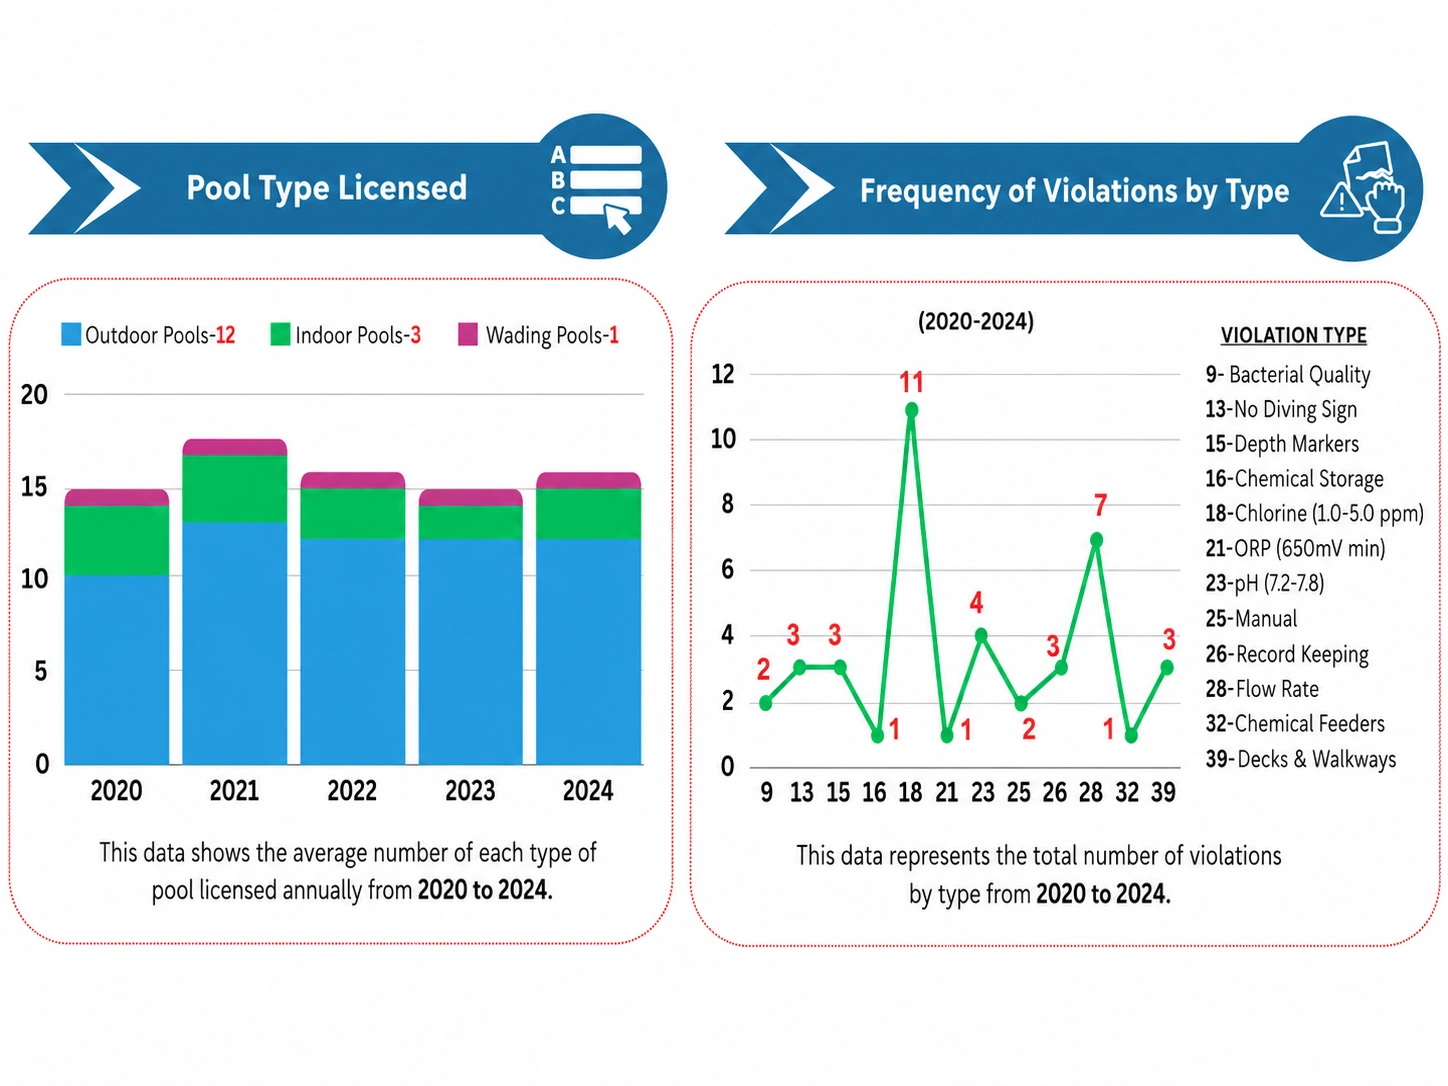
Outdoor pools made up most of the average licensed pool types. The most frequently recorded violation type was chlorine concentration.
| Pool Type | Average Licensed |
|---|---|
| Outdoor pools | 12 |
| Indoor pools | 3 |
| Wading pools | 1 |
| Violation Code | Violation Type | Frequency |
|---|---|---|
| 9 | Bacterial quality | 2 |
| 13 | No diving sign | 3 |
| 15 | Depth markers | 3 |
| 16 | Chemical storage | 1 |
| 18 | Chlorine, 1.0-5.0 ppm | 11 |
| 21 | ORP, 650mV minimum | 1 |
| 23 | pH, 7.2-7.8 | 4 |
| 25 | Manual | 2 |
| 26 | Record keeping | 3 |
| 28 | Flow rate | 7 |
| 32 | Chemical feeders | 1 |
| 39 | Decks and walkways | 3 |
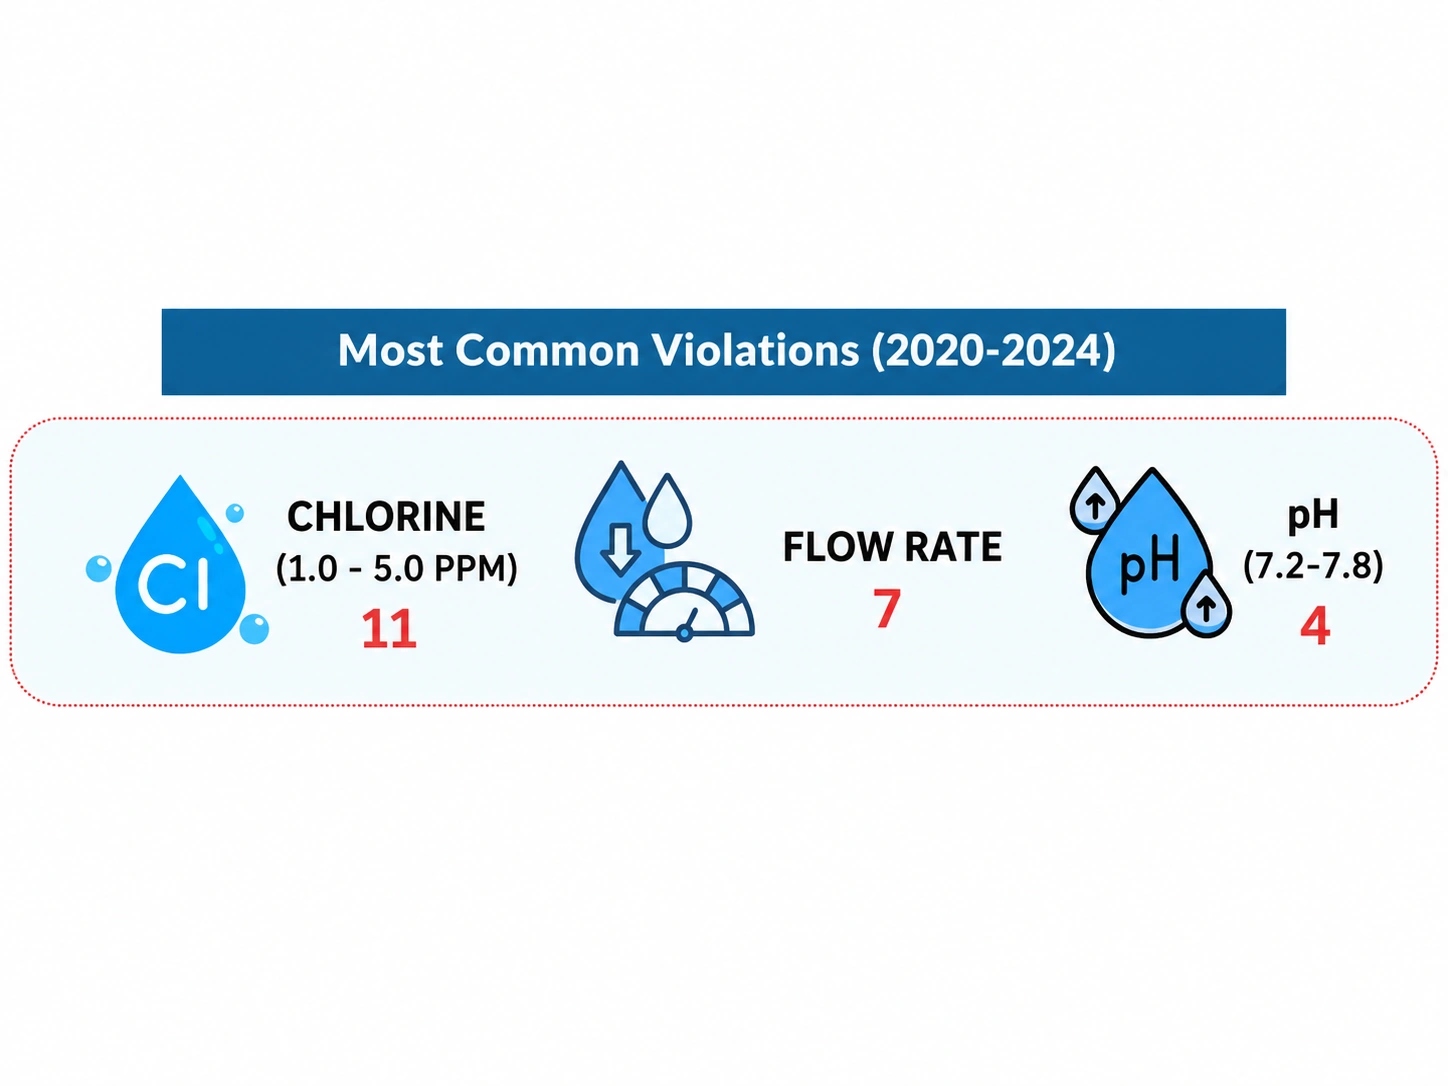
The three most common violation categories shown were chlorine concentration, flow rate, and pH.
| Violation | Count |
|---|---|
| Chlorine, 1.0-5.0 ppm | 11 |
| Flow rate | 7 |
| pH, 7.2-7.8 | 4 |
Select an image to open a larger version, or view the original PDF.
Public pool safety overview, waterborne illness, outbreak data, and sources.
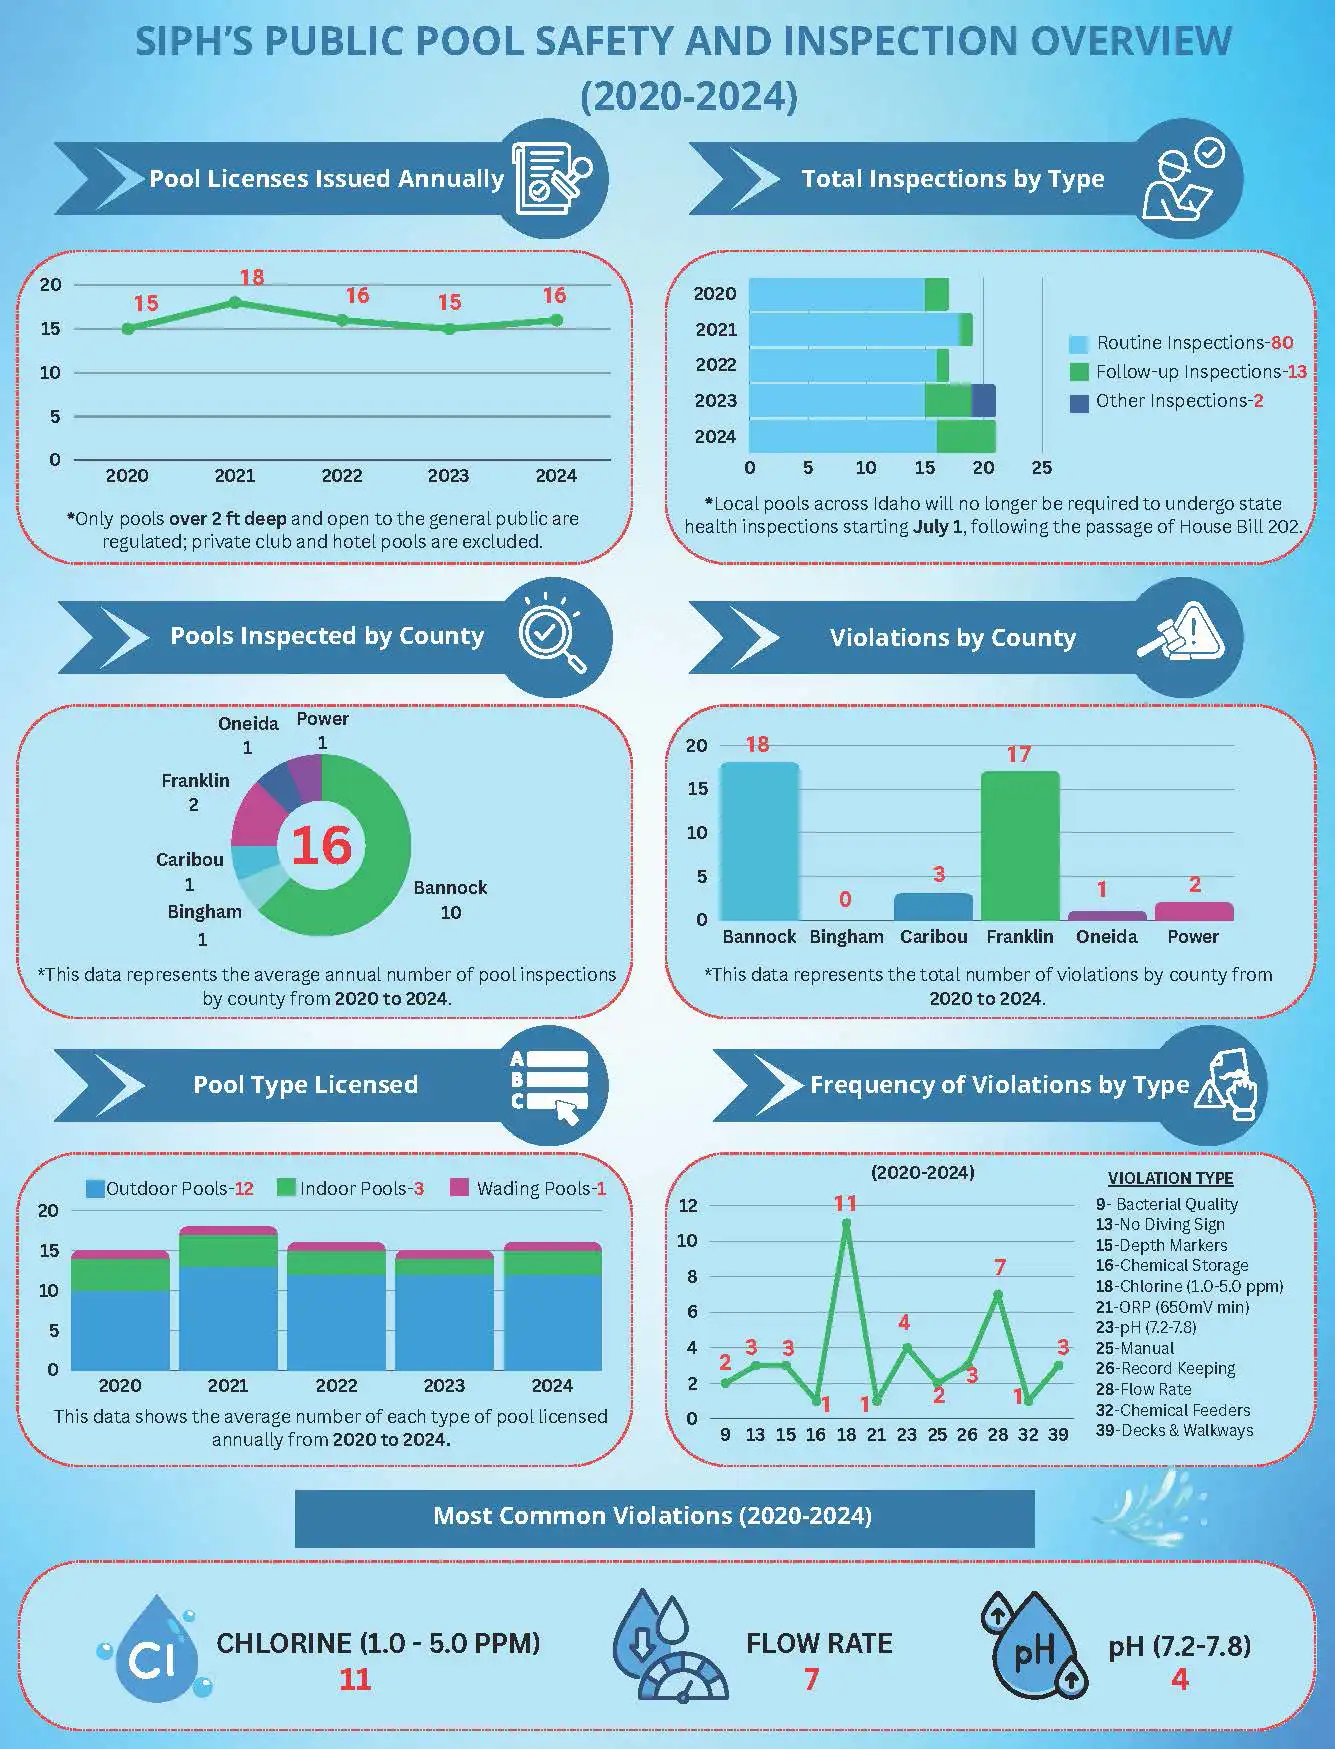
Licenses, inspections, county activity, pool types, and common violations.